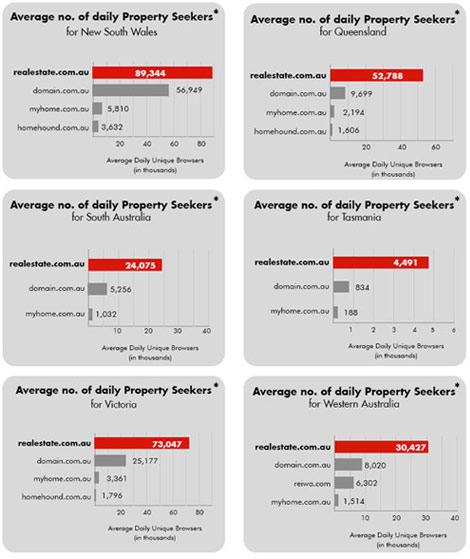
Nielson Netratings has released state by state unique browser figures and it shows REA Australia to have a resounding lead in. As I have mentioned before I have no real interest in Nielson as far as getting an overall view of the industry as it only has about 15 – 20 real estate sites indexed out of 8,000, but to know who is on top then this is a reasonable measure.
So here is a graphical excerpt from the Nielson Ratings State by State.

25 Comments
Craig
Is it possible to see full breakdown past the top 3?
Glenn
188!!! Thats the best belly laugh I have had in a while.. Sad sad sad.. Many decent individual agent websites would be passing through 200 by lunch time on an average day.. How can a national portal only do 188 visitors for a whole state!!! Even Domain should hang their head in shame with Tassie’s results.. Queensland is no better for either of them as well.
Peter
Craig, sorry mate that is the only information I could get. If I can get my hands on more I will.
Stellabella
You can try http://www.alexa.com for side-by-side comparisons on most URLs. Try using a string that identifies state content on the specific site to get down to that level.
Glenn
Alexa is very inaccurate for low ranking sites(ie.. not microsoft, ninemsn etc etc. Anybody outside the top 100,000 websites int he world should not count on their ranking. It is very easy to artificially create a higher ranking for a low ranking site.. Please note, I am not suggesting a HIGH ranking, but a higher ranking.
REA, Domain, Homehound and Myhome all fit right into that 100,000 or so figure.. here is there comparison graph
http://www.alexa.com/data/details/traffic_details?site0=www.homehound.com.au&site1=www.realestate.com.au&site2=www.domain.com.au&site3=www.myhome.com.au&y=r&z=3&h=300&w=610&range=1y&size=Medium&url=www.homehound.com.au
Note the bottom two, homehound and myhome, jump around alot. The less traffic you get the less accurate it gets.
Elizabeth
Good Evening,
Glen I have to agree with you that some of the results are indeed laughable.
However it brings into question yet again how some of the portals spend so much money on marketing to yield little to no results. I remember being told by my local L.J Hooker franchise outlet that Myhome would come and kill domain and realestate, as their CEO had a close relationship with the Packers … and so forth.
An interesting conversation today from my local L.J Hooker office.
They say now that Myhome is dead and that they are pulling out.
Apparently they do not need Myhome as the L.J Hooker site “attracts 1.5 million visitors per month”. This quote is from a copy of what appeared in the Australian Jewish News, and was given to me by the local outlet.
The quote is from Warren McCarthy the MD of L.J Hooker, and the article itself was supplied by L.J Hooker. The article is on page 13 of the Australian Jewish News October 19.
1.5 million visitors per month seemed incredibly high.
So I used the site which Glen mentions above and came up with a very interesting figure.
L.J Hooker essentially flat lines just above 0.001 where as domain is hovering under 0.02 and realestate ranges from 0.03 to 0.035
If I match this to the graphs above this equates to:
realestate – 3 to 3.5 million visitors
Domain – just under 2 million visitors
L.J Hooker – around 100 000 visitors
Peter and Glen, can you assist me and check these figures? Can we get a picture of just how many people visit L.J Hookers site?
I have a suspicion that all is not as it is published.
E
Peter
According to the latest Nielson Netratings for September 2007.
Monthly (UB’s) Unique Browsers (total in brackets includes return visits by same UB’s)
1. realestate.com.au 3,813,031 (12,372,255)
2 domain.com.au 1,904,948 (4,311,636)
3. myhome.com.au Pty 370,574 (520,474)
4 ljhooker.com.au 292,210 (499,681)
5 raywhite.com.au 228,536 (372,647)
6 eldersrealestate.com.au 97,329 (145,760)
Hope this helps…Maybe we are back to the 90’s quoting ‘hits’
Elizabeth
Good morning,
Thank you Peter, these figures appear to match my own investigations.
It would seem to me that the MD of L.J Hooker suffers from either of the following points:
1) He has absolutely no idea about the Internet and how to measure traffic.
2) Some other reason?
I am guessing, like most Franchisees, they (L.J Hooker franchisees) are paying exorbitant internet/online franchise fees.
It is a pity that they are paying for 1.5 million people, yet are being delivered 292, 210.
Perhaps the franchisees should start asking questions!
E
snoop
Jewish news
Sounds A credible publication.
Glenn
E
You will probably remember a many posts where I and others have said directly comparing statistics generated from the internet is next to impossible… It is all about the perspective and positioning you are coming from and as is often the case, it is about what is not said.
I have not read the article but from what you have quoted they never said they had 1.5 million people viewing the site, thats what you interpreted, and obviously thats how they wanted you to interpret it. They are probably counting individual visits and then totalling each day.
As an example, lets say each letter represents an individual person visiting that site (so if they appear twice in day they have visited the site twice that day.. once say at 10am, and again say at 11:30am) then :
Monday – A, B, C, D, A, E, A, B, F (9 Visits from 6 Unique Visitors)
Tuesday
Glenn
Just for the record.. the stats used in the articles example is Average Daily Property Seekers also known as average daily unique browsers….
This is average daily unique browsers.
For my example this would be (Unique visitors of 6 4 5 8 4=27 divided by 5 days) which is 5.4
Confused yet ?
Glenn
Elizabeth
Good Morning
Glen, you were correct, I am slightly confused now.
But what you have demonstrated is that L.J Hooker may have used their own way of adding up ‘Visitors’ to l.jhooker.com
Yet, Nielsen Netratings which analyses websites comes up with a more realistic and meaningful number.
It would be very interesting to see what the Franchisees think of this practice, as they would be able to measure the effectiveness of the site by the number of leads and property page views they get.
Perhaps the author of this article (as the article was supplied by L.J Hooker), Warren McCarthy could contribute to this Blog and clarify the exact way the “Visitors” number was calculated?
If there is nothing wrong in the method and number derived, then he should be able to clear this up instantly.
However, if there is no reply from him…
E
max
LJH quote property ‘visits’ as it sounds bigger. As in, property visits – they nothing like VisitorS.
snoop
I wonder what the percentage is of real buyers vs tyrekickers.?
What is the percentage of people looking for rental properties >50%
Granted REA is way in front but I suspect half their traffic is Non Buyers or sellers.
Glenn
So LJH have just created sneaky way of saying pageviews… REA also releases their property views as well which should be directly comparable and as you would have thought.. LJH do not compare well, but thats to be expected I suppose.
Adam
What is the percentage of REA’s traffic that is agents prospecting for more listings ? Anyone want to guess ?
Glenn
Adam,
A damn lot.. but agents use it for much more than listing prospecting.. We use it a few ways unique ways, most which I am not willing to openly share, but one I am and that is for analysing our local market as a whole and the individual participants in that market allocating each a market share of current listing pool and recent sales.
Think about it this way… Just about everyone is on realestate.com.au (and if they are not their market share would probably be tiny anyway) and everyone has all of their listings on the system. So what better way is there to compare current listing portfolios of our immediate competitors. In our area all agents mark the listing as “Under Contract” as well so you can also measure and track sales performance.
Is it accurate..?? Probably about the same accuracy as a sign count. Just as all agencies have listings that do not have a signboard our the front so do we all have sales that just dont make it to the internet.. Some agents fudge signs and certainly some fudge their properties on the net, but as a way to track market share, trends and movement, its easier and a damn site quicker than driving the streets.
Saying that, we still do the traditional sign count as well both as a cross check and for other reasons but it’s interesting to note that the two graphs are virtually identical. Differences between them relate to the medium each represents. Such as if an agency gets a new townhouse development that might have one sign up the front, but they might but 3 or 4 different types of units on the web..
Getting the information is not hard and a simple matter of crafting the URL’s to return exactly what you want it too. I can update a snapshot of our market in about 15-20 minutes.. How long would a signcount take you.. ?
The problem with sign counts is that you cant prove them to a seller.. You could have just made that up… and many times that other agent is showing them a signcount that is totally different than yours. But not the internet.
As an example.. lets take it a step further.. Imagine your at an appraisal and a salesperson from a minor agency in the area who has a handful of listings and couple of sales a month has just been in there before you claiming to have majority market share…
“Mr Jones.. You mentioned that ABC Realty said they were a leader in our local area, and certainly they are a great little agency however there are many agencies in our area that make that very same claim and it can be very hard for sellers to figure out the truth. If you allow me, I can show you indisputable facts that you can rely on using Australia’s largest independent property portal which will show you that we actually have four or five times more properties currently under contract and about two or three times as many listings for sale right now. There really is only one leader in this district and thats us, XYZ Realty.. ”
Cheeky??? You bet.. but you can back it up with the other agents own data… right in the sellers own home, LIVE.
There is stacks more you can do using the portals.. but that’s just a start.
So yeah.. we rack up a bit of traffic, property views, etc etc but for unique browsers we would not add much.
max
look the fact is a UB or UV doesnt really mean a person. If some cleans out their cookies and come back to the site they are counted again… heaps of people look at home and and work meaning they are 2 UB/UV’s.
My point is, no, its not an exact science but the fact is its the indusrty standard and all sites are audited on the same things by the same people.
Sure 3,000,000 UV’s doesnt actually mean 3,000,000 people but for REA its still double of domain….
Glenn
Nobody is arguing with you.. I personally rack up at least 7 UB’s every single month across multiple browsers on laptop, home pc, work pc and mobile phone..
Neilsens has even publicly stated that one of their own surveys has revealed that something like 30 or 40% (the actual number evades me.. ) of people clear their cookies at least once a month.
The upside is that effects the stats for each and every website they visit so for comparison purposes it matters not.. . but under no circumstances can UB equate to individual people.. but they all try that.
Elizabeth
Good morning,
I would just like to congratulate Robert S on his Franchisors new website http://www.randw.com.au
Is there some new branding as well?
E
Adam
I find it interesting that RandW use the MyDesktop system to power the backend of their website.
We have been trying to get MyDesktop to allow us an XML feed of all of our properties that we can ‘upload’ on a daily basis to our own database and then put onto our own website. Instead they only offer an archaic system of letting us wrap their data into some CSS scripts for display.
They do have an XML system they use to upload to the major portals like REA and DOMAIN, but ‘under no circumstances’ will they allow a stand alone agent site to use that technology.
So what will end up happening, is we will use MYDESKTOP to upload to the portals, but then ‘double handle’ everything getting it into our own website.
I wonder if someone from MyDesktop would care to reply to this ?
Robert Simeon
Thanks E,
I believe it still has some way to go for further improvement(s) – however many believe they are headed in the right direction and the lines are clean.
Like many businesses today with too bigger names and initials ie Kentucky Fried Chicken now equates to KFC. I don’t believe we will be (at this stage) losing the Richardson & Wrench brand name given that this year it celebrates 150 years of existence. The big red R&W will be the highlight in print and online advertising which will obviously provide greater definition and consumer recognition of the brand. It was important that we launched the R&W before Ray White.
The new branding will be kept very simple to attain greater consumer awareness. Thanks for the compliment as I like many others enjoy the new funky branding changes.
Cheers
snoop
Question
Do any consumers really care about Brands???
I look in the windows and at their ads.
Who has the listings and the window full of properties actualy for sale rather than more than 50% of window pics having sold pics on them gets my custom.
Might have loyalty to an agent who has done a prof job for me.
Brand loyalty Zero.
Lucas
Adam, there is a product called PortalPusher that will give you an xml feed in REAXML format (the same format used by REA). The system is web based and will push out to most of the major portals in Australia as well for a flat monthly fee.
Cheers
Lucas
The url for the previous post is http://www.portalpusher.com.au